
A truthful energy comparison needs equal useful output, measured operating hours and consistent power boundaries. Mixing boundaries can count the same loss twice. Refer to the gearbox energy efficiency guidance. Record kWh at grid and output torque-speed where instruments are available. Use duty-equivalent conditions for the comparison.
Define where energy is measured
Consider speed-dependent friction
Add maintenance and capital costs
Define where energy is measured
Grid electrical input, motor shaft power and gearbox output power are different quantities; a motor upgrade changes one efficiency while reducer replacement changes another.
Mixing boundaries can count the same loss twice; draw the energy path and location of measurements.
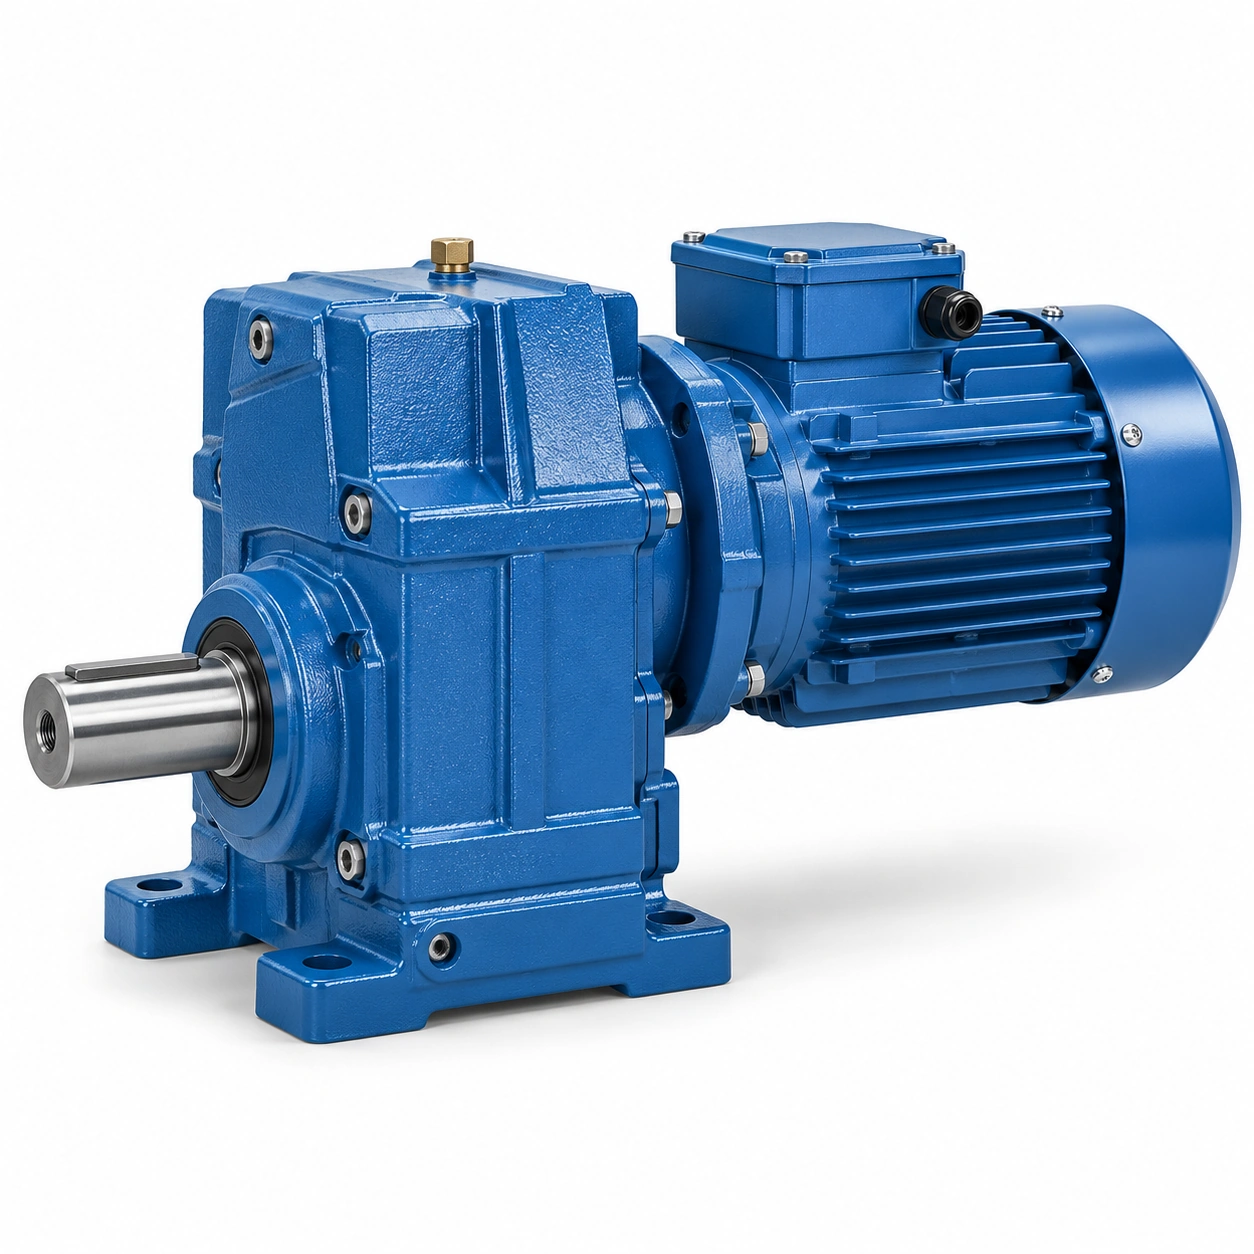
Record kWh at grid and output torque-speed where instruments are available; compare both designs at the same useful work output; a larger motor may use more electricity even with the same reducer rating.
Calculate mechanical output correctly
Shaft power is torque times rotational speed; a machine running half speed may process a different amount of material.
Changing throughput while comparing kWh creates a false gearbox efficiency finding; measure or estimate loaded torque and output rpm.
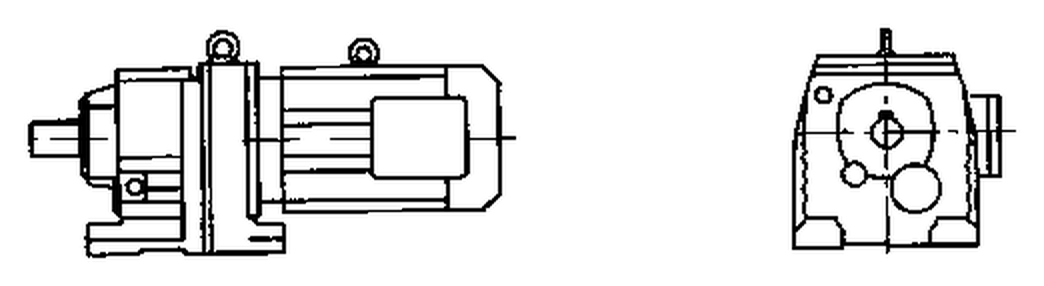
Normalize input energy against the same production units or output work; use duty-equivalent conditions for the comparison; a reduction in total kWh is not automatically a gearbox-only saving.
Separate gear and motor losses
Motor copper, iron and fan losses differ from gear contact and bearing losses; improving a reducer does not remove the inverter or motor contribution.
A combined drive efficiency claim may conceal the origin of the difference; request individual motor and gearbox efficiency data where possible.
Document assumed conditions for each component efficiency; keep combined system calculations transparent and reproducible; the same headline efficiency can describe very different configurations.
Consider speed-dependent friction
Gear mesh, bearings, seals and oil churning vary across speed and temperature; no-load losses can matter when a machine idles for long periods.
A full-load efficiency number may misrepresent lightly loaded operation; record time at production, idle and stand-by states.

Ask for loss data over the actual relevant operating range; evaluate the complete duty cycle rather than one favorable point; extrapolation from rated load can exaggerate savings.
Compute lifetime hours carefully
Energy differences accumulate only during the hours and loads actually experienced; a seasonal machine may operate far less than a continuous conveyor.
Assuming every year contains continuous full-load operation overstates savings; extract operating hours from plant production records.
Separate working days, maintenance stops and light-load production; model consumption using the relevant hour distribution; an annualized figure without a duty source lacks decision value.
A seasonal machine may operate far less than a continuous conveyor. Assuming every year contains continuous full-load operation overstates savings. Examine the gearbox energy efficiency layout example. Separate working days, maintenance stops and light-load production. Model consumption using the relevant hour distribution.
Include VFD process effects
Changing speed control can reduce process energy independently of reducer loss; a fan or pump may save energy from operating at different process output.
Claiming all savings for a new gearbox misstates the cause; hold useful production output constant in before-after comparisons.

Record drive frequency and measured electrical kWh by process state; identify what changed in motor, gearbox and control strategy; a successful process optimization is not automatically a gear efficiency improvement.
Add maintenance and capital costs
Purchase price is only one part of an energy upgrade economics model; some high-efficiency arrangements require different seals, adapters or servicing.
An energy-only model may miss downtime from the retrofit; include supply scope, installation, lubricant and expected maintenance labor.
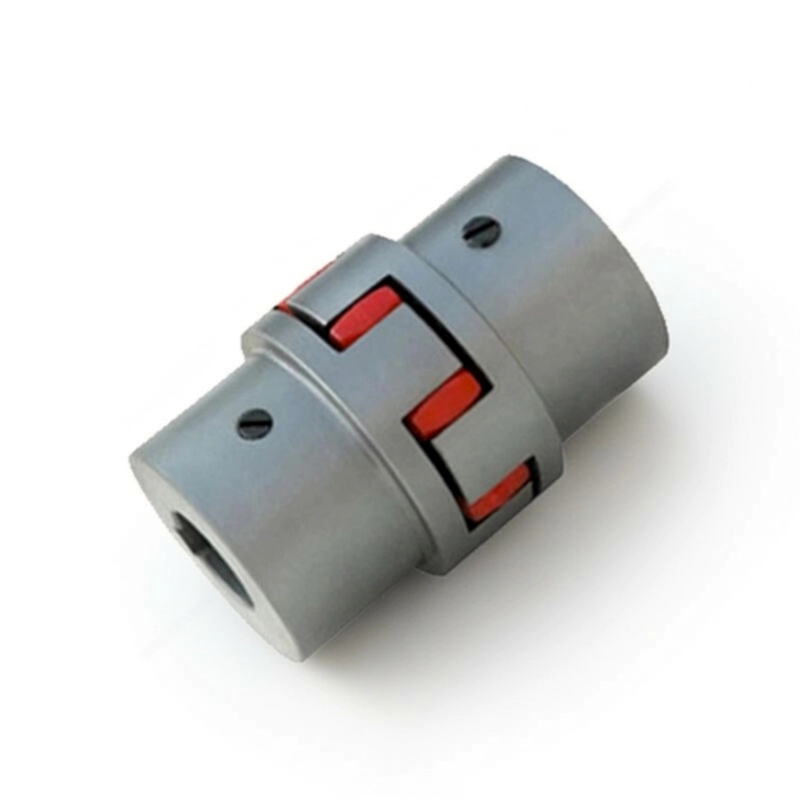
Use actual energy tariffs and documented service costs; compare total installed lifecycle scenarios; a low payback claim is unreliable without engineering and cost assumptions.
Verify savings with a measurement plan
The plant should define a repeatable comparison window before changes begin; different material batches, temperatures and process rates affect electrical use.
A single before-after meter snapshot proves little; plan comparable operating periods and normalization variables.
Retain meter locations, production totals and operating conditions; report savings as measured with uncertainty and limits; unverified percentages should not enter a purchasing promise.
Illustrative engineering scenario: An industrial energy review comparing transmission alternatives
Two industrial drive packages are offered for the same conveyor. The quotation for one emphasizes a high helical gearbox efficiency, while the other quotes combined motor-and-gearbox efficiency. The energy analyst cannot compare those percentages until both refer to the same boundaries. Electrical input at the plant meter includes losses in the inverter and motor as well as in the gearbox. Shaft mechanical output describes the useful work delivered to the driven machine. When evaluating alternatives, the plant records either matched electrical input while doing the same work or a consistent model using verified component curves. Combining a motor efficiency with a system efficiency by multiplication would count some losses twice.
The conveyor does not run at full load all year. It idles between batches, operates at partial load during cleaning and works hardest during seasonal peaks. A simple example multiplying one rated-load loss by 8,760 hours would be unrealistic. The engineering team instead extracts actual operating time by duty band and a representative electricity price. The comparison records how much useful production each drive delivers during the measured period; if one drive changes throughput, energy per processed unit may be more informative than total kWh. These boundaries are defined before the investment is evaluated.
Maintenance and installation are then added to the analysis. One option fits the existing base and coupling while another needs a larger frame, different oil service and a control modification. The model includes these costs with sources and uncertainty ranges. An optimistic energy case, central case and conservative case can reveal whether the preferred quotation changes under plausible assumptions. The proposal should not claim a particular percentage saving unless a repeatable test or credible source establishes it. The goal is an honest comparison of cost per unit of useful work, not a marketing claim detached from machine operation.
An energy case may change simply because the production schedule changes. A reducer that operates only two months each year offers a different opportunity than one that runs near continuously. For each scenario, record the hours, process load and electricity tariff that generate the projected cost. If a result depends on an assumed future price or availability rate, label that uncertainty. A finance reviewer should be able to reconstruct the arithmetic without mistaking assumptions for observations.
The cost analyst may include a separate operational benefit from improved speed control, but should label it as a process change rather than a gearbox efficiency gain. Production supervisors can help identify whether throughput, product quality or operating hours changed during the comparison. The energy finding becomes more credible when the calculation explains its denominator and the conditions under which it would no longer apply.
Five-stage review for an industrial energy review comparing transmission alternatives
- Define where energy is measuredDraw the energy path and location of measurements. Compare both designs at the same useful work output.
- Calculate mechanical output correctlyNormalize input energy against the same production units or output work. A reduction in total kWh is not automatically a gearbox-only saving.
- Consider speed-dependent frictionRecord time at production, idle and stand-by states. Evaluate the complete duty cycle rather than one favorable point.
- Include VFD process effectsRecord drive frequency and measured electrical kWh by process state. A successful process optimization is not automatically a gear efficiency improvement.
- Verify savings with a measurement planPlan comparable operating periods and normalization variables. Report savings as measured with uncertainty and limits.
Engineering comparison matrix: helical gearbox efficiency energy consumption
| Engineering question | Evidence to collect | Review decision |
|---|---|---|
| Define where energy is measured | Record kWh at grid and output torque-speed where instruments are available. | Compare both designs at the same useful work output. |
| Calculate mechanical output correctly | Normalize input energy against the same production units or output work. | Use duty-equivalent conditions for the comparison. |
| Separate gear and motor losses | Document assumed conditions for each component efficiency. | Keep combined system calculations transparent and reproducible. |
| Consider speed-dependent friction | Ask for loss data over the actual relevant operating range. | Evaluate the complete duty cycle rather than one favorable point. |
| Compute lifetime hours carefully | Separate working days, maintenance stops and light-load production. | Model consumption using the relevant hour distribution. |
| Include VFD process effects | Record drive frequency and measured electrical kWh by process state. | Identify what changed in motor, gearbox and control strategy. |
Frequently Asked Questions
Is motor efficiency included in the gearbox efficiency percentage?
Why do load hours matter more than a maximum efficiency figure?
Can lower kWh alone prove that a new gearbox is better?
What other costs belong in an energy upgrade calculation?
What makes a final review credible for an industrial energy review comparing transmission alternatives?
Some high-efficiency arrangements require different seals, adapters or servicing. When comparing actual mounting geometry, use the gearbox energy efficiency configuration options. Use actual energy tariffs and documented service costs.
Plan comparable operating periods and normalization variables. For an engineering quotation that records the open conditions, contact the technical team about gearbox energy efficiency. Report savings as measured with uncertainty and limits.
Engineering sources for Helical Gearbox Efficiency and Motor Electricity Use
For the helical gearbox efficiency and motor electricity use workflow, consult these reference documents alongside the actual model installation manual:
- Helical Gearbox Efficiency and Motor Electricity Use: ABB, Effects of variable speed drives on motors (analysis).
- Helical Gearbox Efficiency and Motor Electricity Use: SEW-EURODRIVE, Basic calculation process (interface review).
- Helical Gearbox Efficiency and Motor Electricity Use: SEW-EURODRIVE, Application-specific service factor (acceptance checks).